
Forget the days of staring at a screen for ten hours, trying to spot a head-and-shoulders pattern that might-or might not-actually be there. The game has changed. We've moved past simple automation into an era where AI in technical analysis is the use of artificial intelligence to augment traditional chart reading through machine learning and real-time data processing . It's no longer just about a bot executing a trade; it's about systems that can "see" market anomalies and sentiment shifts long before a human trader notices a flicker on the candle chart.
The Shift from Static to Dynamic Analysis
Traditional technical analysis is essentially looking in the rearview mirror. You use a 200-day moving average or a Relative Strength Index (RSI) and assume those static numbers apply to today's volatility. But markets aren't static. This is where Machine Learning changes the math. Instead of using a fixed period for an indicator, AI systems can dynamically adjust these parameters in real-time based on current volatility.
Imagine a tool that realizes the market has shifted from a trending phase to a range-bound phase and automatically switches its logic from trend-following to mean-reversion. Platforms like TradeStation and Tickeron are already baking this kind of predictive analytics into their interfaces. They aren't just showing you a line; they're predicting the likely path of that line based on millions of similar historical snapshots.
Merging Old School Theory with LLMs
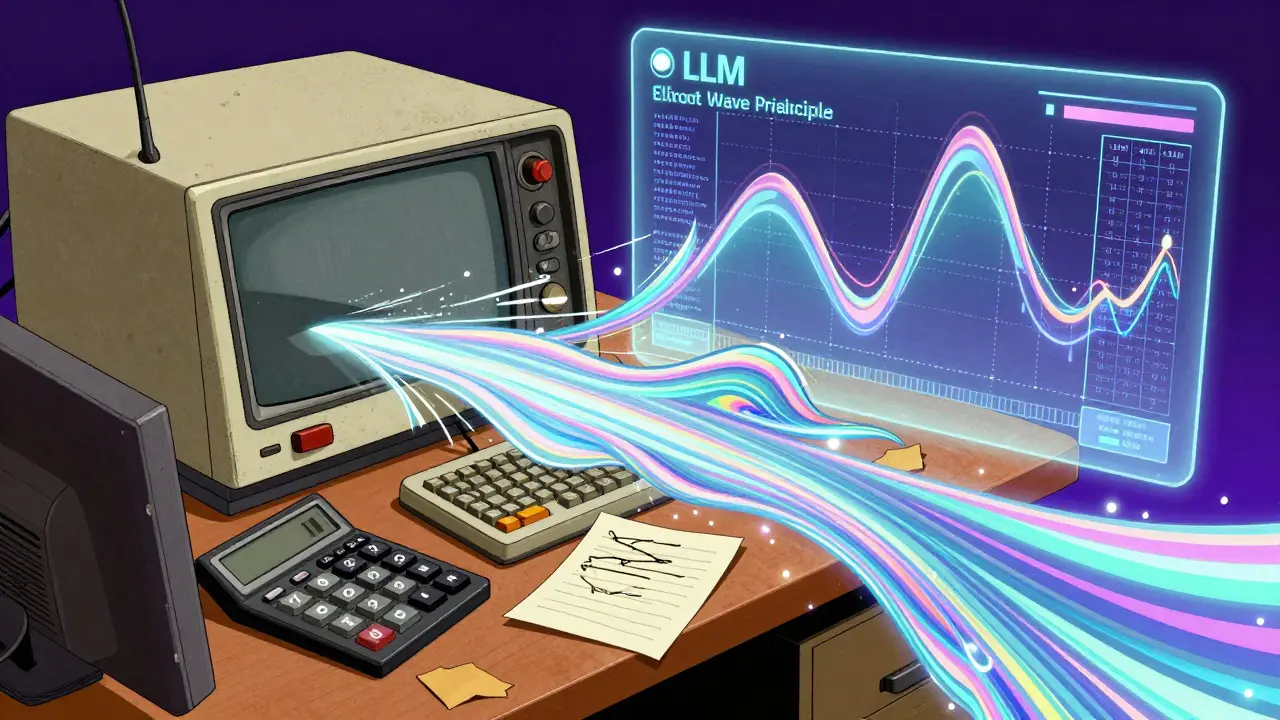
One of the most interesting developments is how we're breathing new life into classic theories. Take the Elliott Wave Principle, a method that categorizes market cycles based on investor psychology. For decades, it's been criticized for being too subjective-two traders can look at the same chart and see two different wave counts.
Now, we're seeing the rise of multi-agent systems, such as the ElliottAgents framework. By using Large Language Models (LLMs), these systems can process the nuanced "language" of market trends and combine it with rigid mathematical rules. This removes the guesswork. Instead of a human arguing about where "Wave 3" begins, the AI analyzes the pattern across thousands of assets simultaneously, providing a probability score rather than a guess.
| Feature | Traditional Analysis | AI-Driven Analysis |
|---|---|---|
| Indicator Parameters | Static (e.g., 14-day RSI) | Dynamic (Self-adjusting) |
| Pattern Recognition | Manual/Visual Scanning | Instantaneous Algorithmic Detection |
| Data Scope | Price and Volume | Price, Volume, Sentiment, On-Chain Data |
| Execution Speed | Human Reaction Time | Millisecond High-Frequency Execution |
The Blockchain Integration Frontier
For those in the crypto space, the most exciting leap is the integration of Blockchain data into AI models. Until now, most technical analysis relied on "CEX data"-what happened on an exchange. But the real truth lives on the ledger.
The future involves AI systems that monitor "whale" movements, liquidity migrations, and smart contract interactions in real-time, blending this on-chain data with traditional price action. If an AI sees a massive amount of stablecoins moving onto an exchange while a bullish chart pattern is forming, the confidence interval for a trade skyrockets. It turns a 2D chart into a 3D map of market intent.
Automated Execution and the Rise of Adaptive Bots
We are moving away from simple "if-this-then-that" bots. The next generation of Trading Bots are adaptive. They don't just follow a script; they learn from their own mistakes. Through reinforcement learning, these bots can simulate thousands of trades in a sandbox, optimize their entry and exit points, and then deploy that strategy in the live market.
This level of automation is also cleaning up the "back office" of trading. Settlement and regulatory reporting-the boring but critical parts of finance-are being automated to reduce human error. When the execution is handled by a predictive system, the risk of a "fat finger" trade that crashes a flash market is significantly lowered.

The Human Element: Risk and Overfitting
It sounds like a utopia, but there's a catch: overfitting. This happens when an AI becomes so obsessed with past data that it creates a perfect model for the past, but fails miserably in the future. It's like memorizing the answers to a test instead of understanding the subject. If a model is too tightly tuned to the 2024 bull market, it will likely blow up the moment the market regime changes in 2026.
This is why the "Centaur" approach-human intuition combined with AI speed-remains the gold standard. AI can find the pattern, but a human can tell if that pattern is irrelevant because of a sudden geopolitical event or a regulatory crackdown that the AI hasn't been trained on yet.
Can AI completely replace human technical analysts?
Not entirely. While AI excels at pattern recognition and processing massive datasets, it lacks "contextual intuition." A human can interpret a sudden news event or a change in government policy that hasn't yet manifested in the data. The most successful traders use AI as a powerful filter to find opportunities, but keep the final decision-making power in human hands.
What is the risk of using off-the-shelf AI trading tools?
Many commercial AI tools are essentially "black boxes." You don't know why they are giving a signal, which makes risk management nearly impossible. If the tool is overfitted to historical data, it may appear highly accurate in backtests but fail during live market volatility. Always look for tools that provide a rationale for their predictions.
How does sentiment analysis fit into technical analysis?
Sentiment analysis uses Natural Language Processing (NLP) to scan social media, news headlines, and forums. By converting public mood into a numerical value, AI can overlay "crowd psychology" onto a price chart. For example, extreme bullish sentiment often signals a market top, providing a powerful contrarian indicator for technical analysts.
Will AI make markets more volatile or more stable?
It's a double-edged sword. AI can increase stability by removing emotional human errors and optimizing liquidity. However, if too many bots use the same AI models, it can lead to "crowded trades," where everyone sells at the exact same millisecond, potentially triggering flash crashes.
Is blockchain data really better than price data?
It's not better, but it is more fundamental. Price data tells you what happened; blockchain data (like wallet inflows/outflows) tells you what is likely to happen. Combining the two allows AI to validate a chart pattern with actual financial movement, leading to a much higher probability of success.
Next Steps for Traders
If you're looking to integrate these tools, start small. Don't hand your entire portfolio over to a bot on day one. Instead, use AI for screening-let the AI find the 10 best setups out of 1,000 coins, and then you do the final analysis on those ten. As you get comfortable with how the AI handles different market regimes, you can gradually automate your execution.


James Bone
Most people treating this like some holy grail are just begging to be exit liquidity. The sheer arrogance of thinking a machine can solve the inherent chaos of human greed is laughable. It's not a revolution, it's just a faster way to lose your shirt if you're too lazy to actually understand market psychology.